Ather Energy
Early beginnings
At Ather Energy, I joined the first team of 2 Data Scientists when the company was still small - around 50 people. While these were early stages and the vehicle was not in production yet, our task was to run tests and gather data, explore, and conceptualize and develop prototypes of features and use-cases with logged data. The data would be streamed from multiple sub-systems and sensors onboard: batteries, motors, throttling, intertial motion unit, etc.
Being a startup, there was of course a whole bunch of other things that we were involved in as well:
- Setting up internal infrastructure / libraries / dashboards for ingesting, parsing and viewing data from various tests
- Production infrastructure discussions: ingestion, analytic, and warehouse layers; Google Cloud/Spark ?
- PR and marketing projects: from the product unveiling at Surge Websummit, to a project with a design firm for an interactive visualization experience at ‘Experience Centers’, to Beta Test Rides at a racetrack.
Projects
Some of the projects I conceptualized and/or co-developed:
Predictive diagnosis of drivetrain health
By extracting features from motor current signals, we were able to develop ‘signatures’ that we could use to build models to detect mechanical faults with the drivetrain: poor allignment, eccentric wheels, motor faults, that could lead to poor efficiency and part failures if ignored.
Detection of speed-bumps
Using a combination of temporal classification and spatial clustering, on data from subsystems, IMU (intertial motion unit), GPS we were able to build a system (~ 95% accuracy) that would classify and flag speed-bumps as scooters would ride around the city and gather data. Once sufficient data would be amassed, this could be used to warn riders in advance on the scooter dashboard.
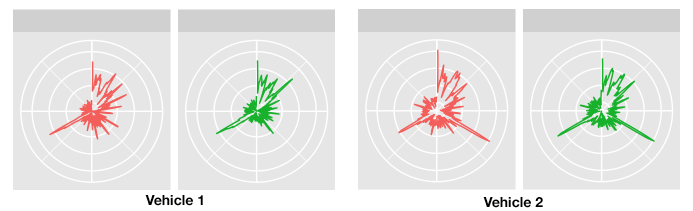
Rider profiling
This was the product of a iterative (and still ongoing) needfinding process, to use data in a more accessible and ‘fun’ form for personalization and engagement with the rider community. By gathering data from several tests, with different riders in different conditions, we looked to develop metrics, and means of visualizing them that would give a user insight into his/her riding style. This was also used in PR projects later on (Blog post - see below), and served a basis for a project with a design firm that I helped manage for an interactive visualization of test rides at ‘Experience Centers’. For an idea with things that I can share, see a side project :)